Showcase 3: Open Top Chamber Experiment
1. Set-up
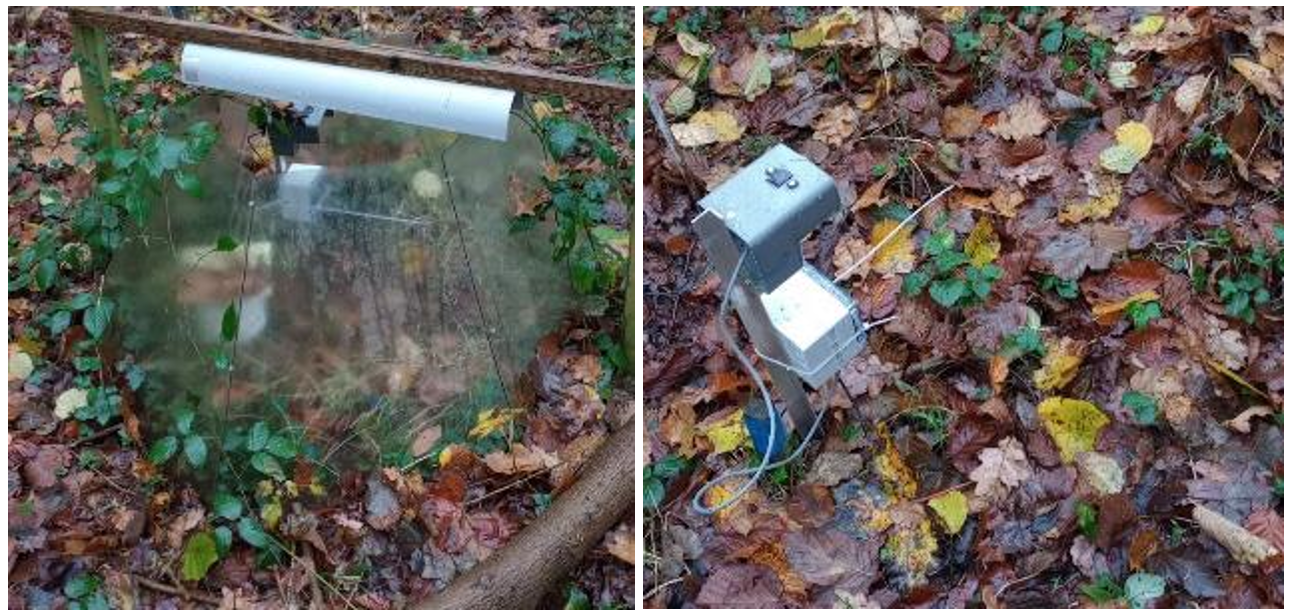
For this showcase, we installed six MIRRA sensor nodes in an open top chamber experiment (De Frenne et al., 2009). An open top chamber is a small plexiglass greenhouse that is open at the top to allow exchange of water and air. Open top chambers result in a warming of the microclimate through the greenhouse effect and are used to study the anticipated effects of climate warming. In this experiment, the changes of vegetation in small plots inside the open top chambers have been monitored for more than 12 years and compared to the changes in control plots under ambient conditions (De Frenne et al., 2015). We installed three sensor nodes inside an open top chamber (figure below, left) and three sensor nodes in a control plot (figure below, right).

2. Microclimate
The figures below show the differences in microclimate between the warming treatment (open top chambers) and the ambient conditions (control).
• The first figure shows a time series. If you adjust the time period, the daily and seasonal fluctuations are clearly visible, e.g., light availability is higher every day around noon and length of the days is longer in summer.
• The second figure shows a summary of the data over the selected time period. In this figure, every point represents one measurement, the violins show the distribution of the data and the box plot shows the median (horizontal line) and the first and third quartile of the data (box).
The data also shows some differences between the microclimate in the open top chamber (warming treatment) compared to the ambient conditions (control):
• Air temperatures are generally a bit higher in the open top chamber than in the control plots.
• Relative humidity is a bit lower and more variable in the control plots than in the open top chambers.
• Soil temperature is slightly higher in the open top chamber than in the control plots.
⚠️Please wait for the interactive graphs below to load. This can take a moment. ⚠️This showcase provided real time microclimate until July 2025, currently monitoring is not live anymore.
3. Effects on plants of the forest floor
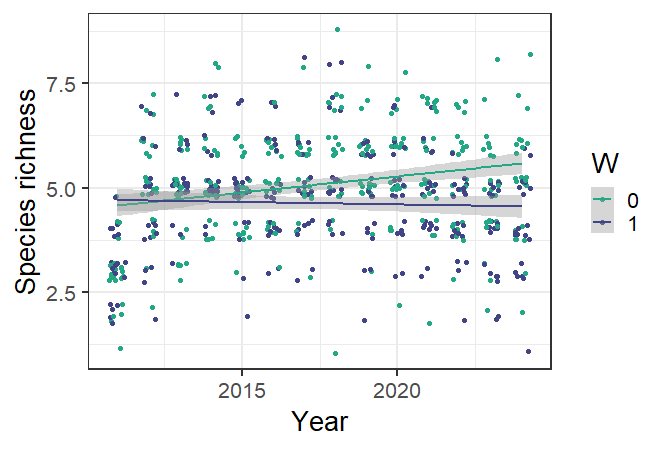
The open top chamber treatment has an effect on the microclimate in the plots and in this way also on the vegetation. The figure below shows the evolution of the species richness in the plots within the open top chambers (blue) and the control plots (green). Each point represents the species richness in a different plot in a different year, the line represents a model on the evolution of the species richness through time. The species richness in the control plots is increasing in time, while the species richness in the open top chamber is slightly decreasing (Govaert et al. 2021).

4. References and raw data
If you want to read more about:
• The experimental set-up and the effects on understorey vegetation, you can read one of our scientific papers on the Open Top Chamber experiment: De Frenne et al., 2015 or Govaert et al., 2021.
If you want to further explore the data, you can download a csv file with the raw data right below the dynamic graphs above