Showcase 2: Formica experiment
1. Set-up
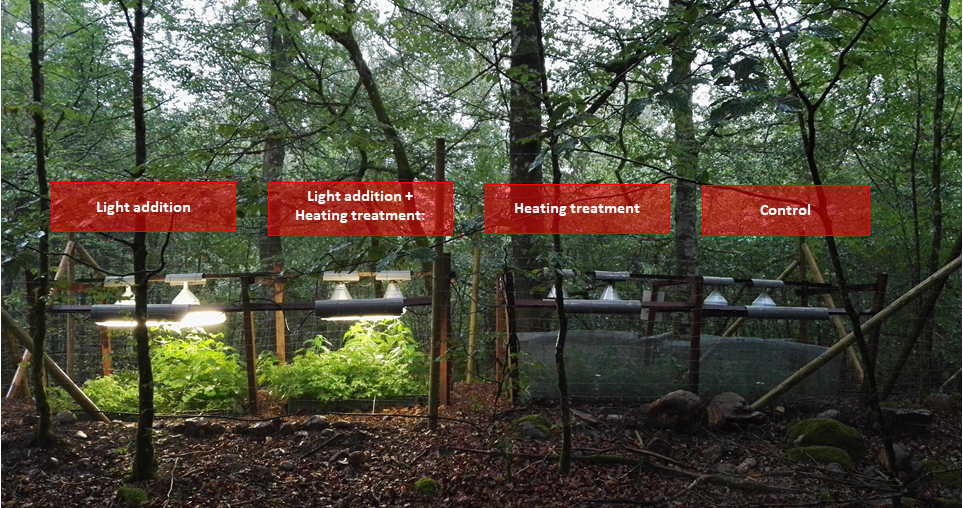
This global change experiment was set up in the framework of the Formica project. It consists of experimental plots in forest edges and forest cores throughout Europe. Every experimental plot consists of four subplots with a different global change treatment: (1) a control plot that represents the ambient site conditions; (2) a light treatment with illumination of the subplot with lamps that represent the light conditions of a small canopy gap; (3) a climate warming treatment with in situ heating by infrared heaters; and (4) a combined light and warming treatment that represents a simultaneous effect of canopy opening and global warming. In the Formica project, the effect of the different treatments on experimental understorey plant communities was evaluated.
For this showcase, we installed eight sensor nodes in the four treatment subplots, both in the edge and in the core of the Aelmoeseneieforest, to demonstrate the effect of the warming treatment, the light treatment and the edge proximity on microclimate and the link with understorey biodiversity.

2. Warming effect
2.1 Microclimate
The figures below show how the different climatic parameters vary in time under the warming treatment (IR heaters) and the ambient conditions (control).
• The first figure shows a time series. If you adjust the time period, the daily and seasonal fluctuations are clearly visible, e.g., air temperature is higher in summer and every day around noon.
• The second figure shows a summary of the data over the selected time period. In this figure, every point represents one measurement, the violins show the distribution of the data and the box plot shows the median (horizontal line) and the first and third quartile of the data (box).
The data shows some clear effects of the warming treatment on the microclimate:
• Air and soil temperatures are higher under the warming treatment
• Relative humidity is lower under the warming treatment
⚠️Please wait for the interactive graphs below to load. This can take a moment.
2.2 Effects on plants of the forest floor
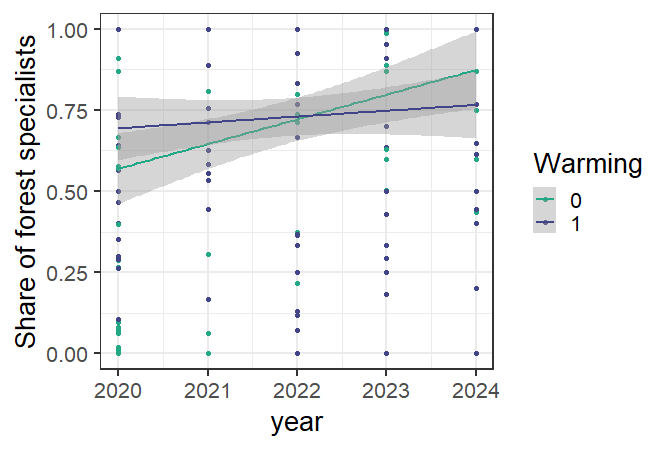
The warming treatment thus clearly creates a warmer and drier microclimate and this treatment has an effect on the plants growing on the forest floor. In the figure below, we see for instance that in the control plots, the share of forest specialist plants such as wood anemone (Anemone nemorosa) is gradually increasing since the start of the experiment in 2020. In the plots with a warming treatment, the share of forest specialists is increasing more slowly, because generalist species, such as stinging nettle (Urtica dioica), withstand the effects of the warming treatment better. More information on the effects on plant species can be found in Sanczuk et al. (2023) or De Pauw et al. (2021).

3. Light addition effect
3.1 Microclimate
The figures below show how the light availability differs between the light treatment (TL lamps) and the ambient conditions (control).
• The first figure shows a time series. If you adjust the time period, the daily and seasonal fluctuations are clearly visible, e.g., light availability is higher every day around noon and length of the days is longer in summer
• The second figure shows a summary of the data over the selected time period. In this figure, every point represents one measurement, the violins show the distribution of the data and the box plot shows the median (horizontal line) and the first and third quartile of the data (box).
The data also shows some clear effects of the treatment on the light availability:
• Light availability is generally higher in the light addition treatment
• Maximum light availability is mostly higher in the light addition treatment and also in the morning and the evening light availability is higher.
⚠️Please wait for the interactive graphs below to load. This can take a moment. ⚠️This showcase provided real time microclimate until October 2025, currently monitoring is not live anymore.
3.2 Effects on plants of the forest floor
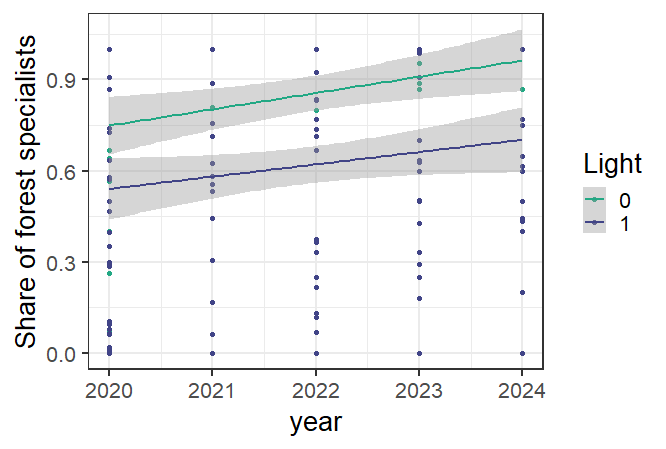
Light availability at the forest floor is an important factor that limits the growth of forest plants. The light addition treatment increases the amount of available light and thus has an effect on the forest plant community on the forest floor. As you can see on the figure below, the share of forest specialist species (such as wood anemone (Anemone nemorosa)) is higher in the control plots (in green), while forest generalist species (such as stinging nettle (Urtica dioica) are slightly more common under the light treatment (in blue). More information on the effects on plant species can be found in Sanczuk et al. (2023) or De Pauw et al. (2021).

4. Effect of the forest edge
4.1 Microclimate
The figures below show how the microclimate differs between the plots at the forest edge and the plot in the forest core.
• The first figure shows a time series. If you adjust the time period, the daily and seasonal fluctuations are clearly visible, e.g., air temperature is higher in summer and every day around noon.
• The second figure shows a summary of the data over the selected time period. In this figure, every point represents one measurement, the violins show the distribution of the data and the box plot shows the median (horizontal line) and the first and third quartile of the data (box).
The data also shows some clear differences between the microclimate in the forest edge plot compared to the forest core:
• Air and soil temperatures are generally a bit higher in the forest edge, certainly on warm moments of the day
• Relative humidity is lower in the forest edge than in the forest core, due to the higher wind speeds
⚠️Please wait for the interactive graphs below to load. This can take a moment. ⚠️This showcase provided real time microclimate until October 2025, currently monitoring is not live anymore.
4.2 Effects on plants of the forest floor
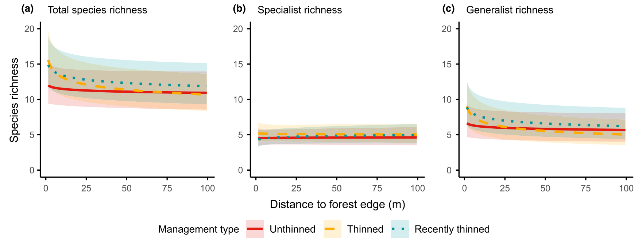
Forest edges are thus warmer, drier and have a higher light availability than forest cores. This has a clear effect on forest understorey plants. In a study in forest edges throughout Europe (Govaert et al., 2020) it was demonstrated that total plant species richness is higher at forest edges (panel a in the figure below). This effect is mostly driven by the increase of generalist species in the warmer forest edges with higher light availability (panel c), while forest specialist plants occur both at forest edges and in forest cores (panel b). Moreover, forest management has an effect on this pattern, with recently thinned forests being more open and having an even higher number of forest generalists at the forest edge.

5. References and raw data
If you want to read more about:
• The Formica project, you can visit the Formica website
• The experimental set-up and the effects on understorey vegetation, you can read one of our scientific papers on the Formica experiment: Sanczuk et al., 2023 or De Pauw et al., 2021.
• The effect of forest edges on microclimate or plant species richness, you can read one of our scientific papers on a pan-European inventory of forest edges: Govaert et al., 2020 and Meeussen et al., 2021.
If you want to further explore the data, you can download a csv file with the raw data right below the dynamic graphs above