Showcase 1: canopy buffering
1. Set-up
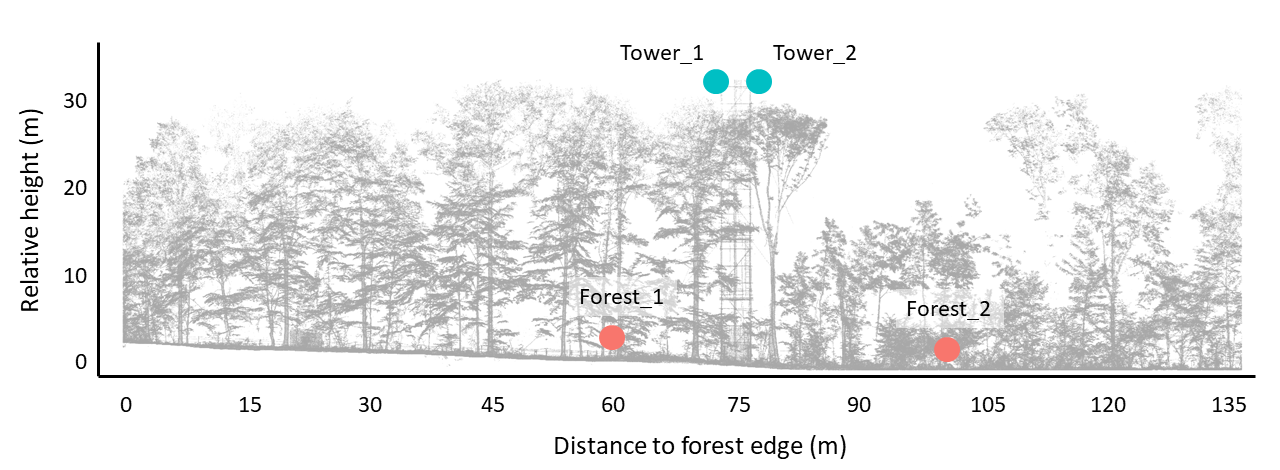
For this showcase we installed several MIRRA sensor nodes on the forest floor to measure the microclimate below the forest canopy, which can be quite different from the macroclimate. We also installed several MIRRA sensor nodes on top of the 35 m tall measuring tower in the Aelmoeseneieforest and on an open location outside the forest. These sensors measure the climate above the canopy or outside the forest, which represents the macroclimate. We compare the difference between the mean of the sensors below the forest canopy with the mean of the sensors above or outside the forest canopy.

2. Microclimate
The figures below show how the different climatic parameters vary over time.
• The first figure shows a time series, in which you can clearly see the diurnal pattern of higher temperatures and light availability around noon.
• The second figure shows a summary of the data over the selected period, which allows to compare the microclimate at the forest floor and the macroclimate above the canopy or outside the forest. In this figure, every point represents one measurement, the violins show the distribution of the data and the box plot shows the median (horizontal line) and the first and third quartile of the data (box).
The data shows some clear differences between the microclimate at the forest floor and the macroclimate above the canopy or outside the forest:
• Air temperatures are generally lower below the canopy, especially when the temperatures are higher (midday, sunny conditions, …)
• Light availability is strongly reduced below the canopy
• Relative humidity is higher below the canopy because of reduced wind speeds
• Soil temperature on the forest floor is more stable than the soil temperature outside the forest.
⚠️Please wait for the interactive graphs below to load. This can take a moment.
3. Offsets: the cooling effect of the forest
Another way to visualize the cooling effect of the forest is by looking at the microclimate offset, i.e. the difference between the microclimate and the macroclimate. For instance, if on a hot summer day, the temperature below the canopy is 29°C and outside the forest 32°C, the temperature offset is -3°C (De Frenne et al., 2019).
• The first figure below shows how the offsets in temperature, relative humidity and light availability (as a fraction: amount of light on the forest floor divided by amount of available light above the canopy) vary in time.
• The second figure shows a summary of the microclimate offsets over the selected period. In this figure, every point represents one offset measurement, the violins show the distribution of the data and the box plot shows the median (horizontal line) and the first and third quartile of the data (box).
⚠️Please wait for the interactive graphs below to load. This can take a moment.
4. Soil temperature buffering
The figures below show how the difference between the air temperature in the forest understorey and the forest soil temperature.
• The first figure shows a time series of the air temperature in the forest and of the soil temperature and of the offset (soil temperature – air temperature). If you adjust the time period, the daily and seasonal fluctuations are clearly visible, e.g., air temperature is higher in summer and every day around noon.
• The second figure shows a summary of the data over the selected period, which allows to compare the microclimate at the forest floor and the macroclimate above the canopy. In this figure, every point represents one measurement, the violins show the distribution of the data and the box plot shows the median (horizontal line) and the first and third quartile of the data (box).
The data shows some clear differences between the air temperature and the soil temperature:
• In general, the soil temperature is much better buffered and less variable than the air temperature, which fluctuates more throughout the day and the season
• Throughout the year, soil temperatures are on average higher than air temperatures, especially in winter (Lembrechts et al., 2021).
⚠️Please wait for the interactive graphs below to load. This can take a moment.
5. References and raw data
If you want to read more about:
• The Aelmoeseneieforest and the measuring tower, you can visit the Aelmoeseneie website
• The buffering effect of tree canopies, you can read our article in Journal of Ecology
• Methodological considerations when starting your own microclimate study, you can read our article in Methods in Ecology & Evolution
If you want to further explore the data, you can download a csv file with the raw data right below the dynamic graphs above